Latin America and the Caribbean.
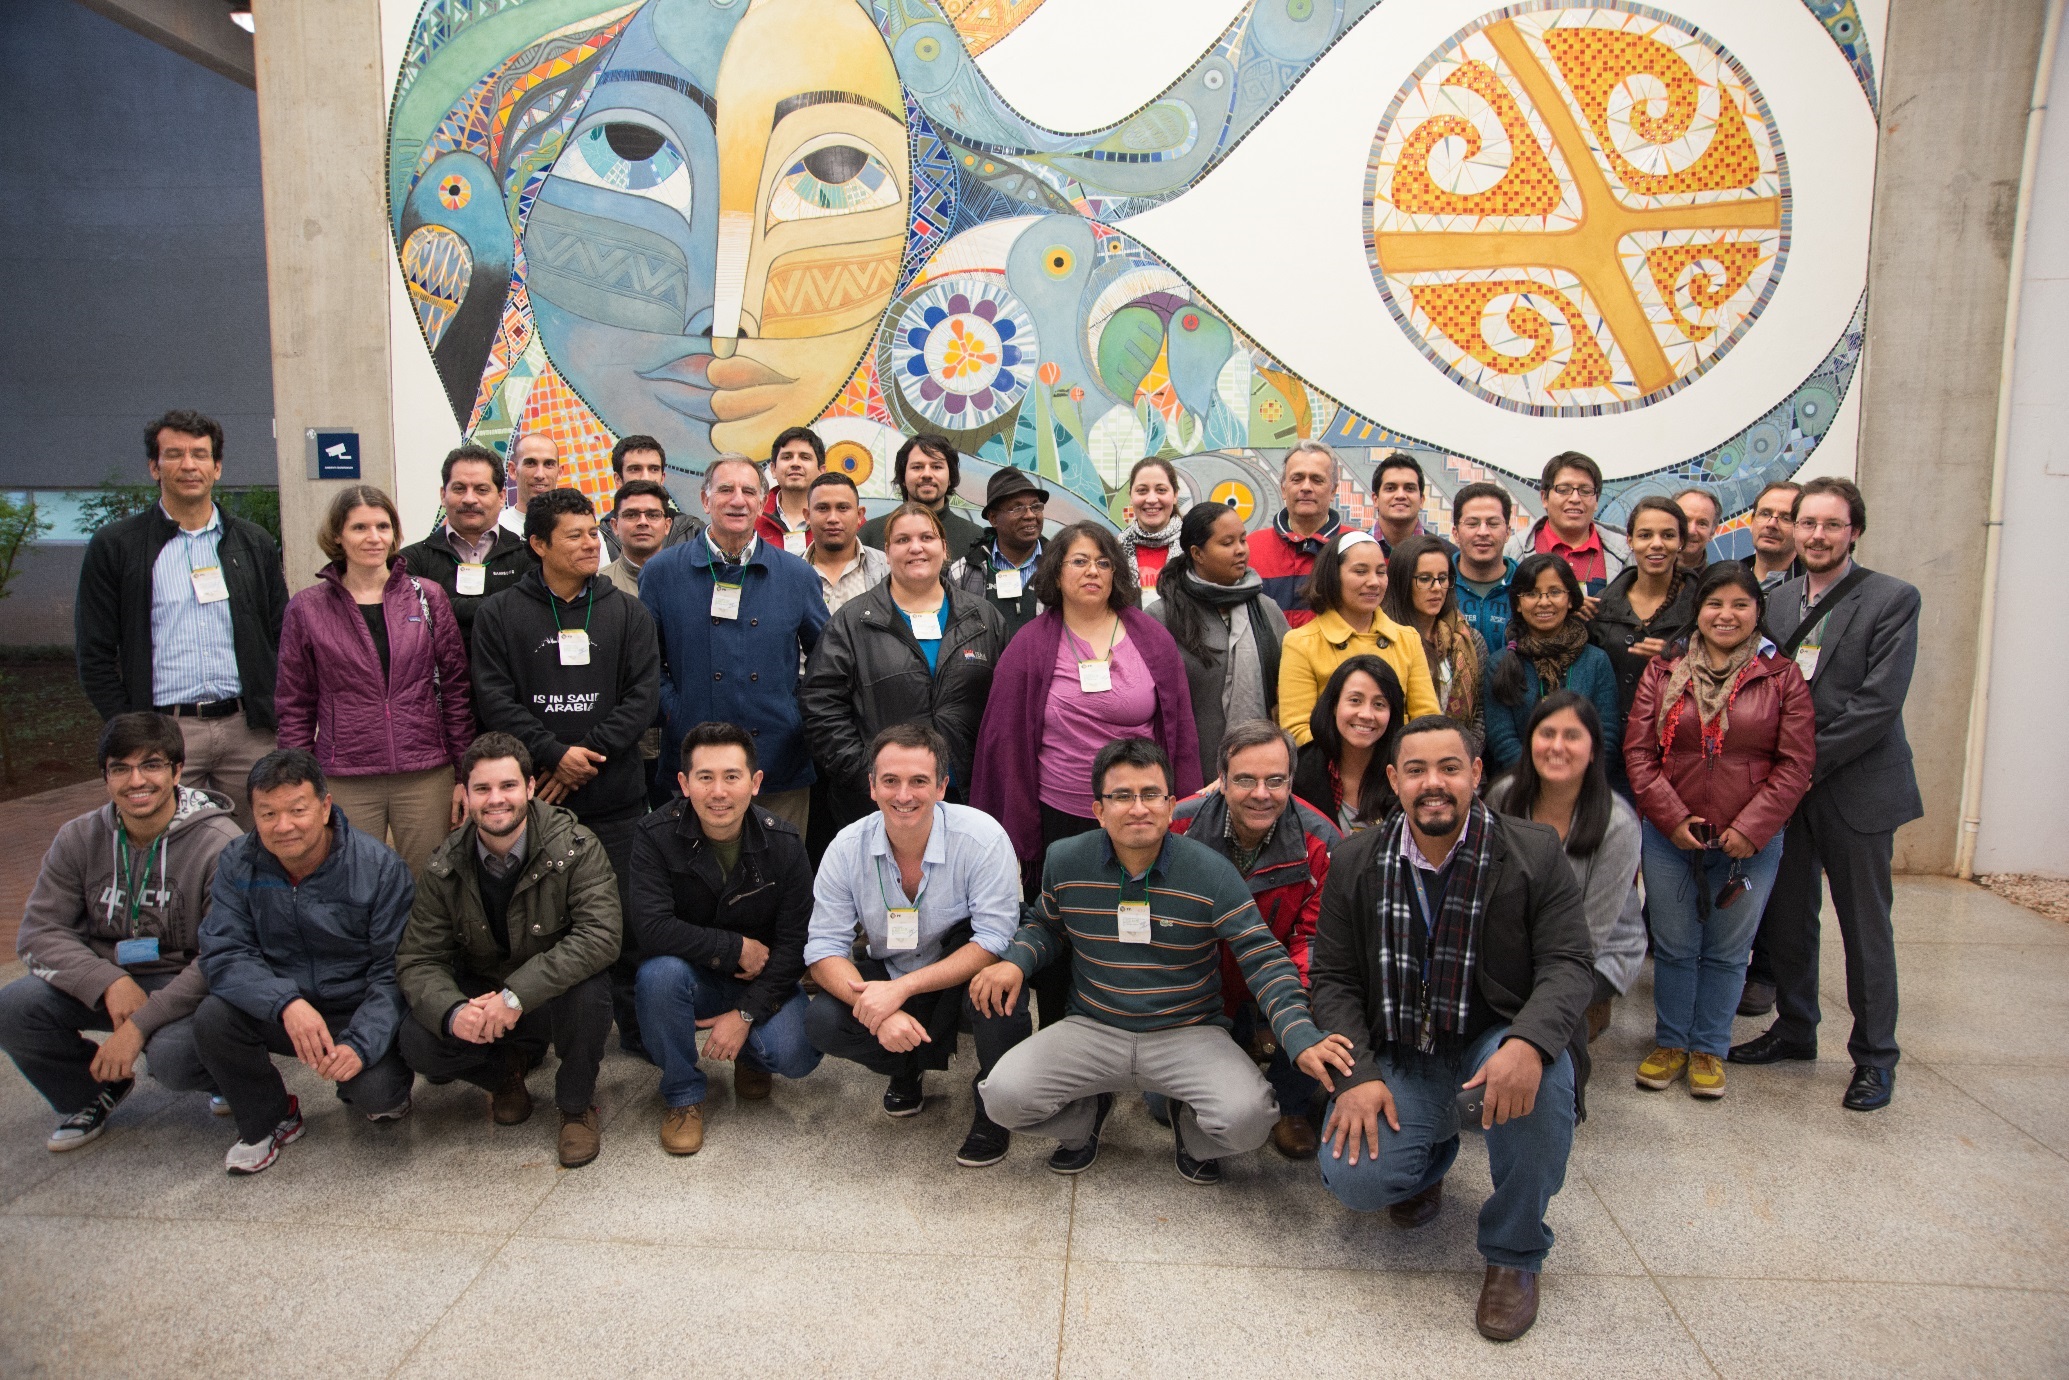
An eight-day training course on the application of satellite remote sensing to support water resources management in Latin America and the Caribbean was held in Brazil in July at Parque Tecnologico Itaipu (PTI), a science and technology park surrounded by lush sub-tropical forest and populated with colourful birds.
The training centre is part of Itaipu Binacional, a transnational initiative between Brazil and Paraguay and the world’s largest generator of renewable energy. The training was presented primarily by NASA–ARSET (Applied Remote Sensing Training) with additional contributions from researchers from Princeton University, VITO (a leading international centre of remote sensing based in Belgium) and LAPIS (a Brazilian remote sensing research centre of excellence). The campus is an innovative reuse of the dormitory town that was built to house the workers that built the Itaipu dam. The PTI includes campuses associated with four Latin American universities, a UNESCO supported solar observatory, a range of other educational and technology-associate initiatives, and the administration buildings of the hydroelectric scheme.

January 2011
Day 1: Introduction
The first session was delivered by experts from NASA-ARSET. NASA not only explore distant worlds, they also maintain 28 earth observation satellites and have two instruments on the International Space Station.
These cover a range of applications from vegetation and fire monitoring to weather observation and earth system modelling. Data collected and generated through all these NASA initiatives are freely available. They also provide plenty of really useful training materials (including from this training event).
The session focussed on the sensors that are most useful in water resource management, introduced the principles of remote sensing and some of the portals for accessing the data. Hands-on activities included data visualisation, using open source products (QGIS and Panoply).
In the afternoon, Professor Humberto Barbosa from LAPIS, based at the Cidade Universitária Maceió Alagoas in Brazil, presented on near real time meteorological remote sensing (RS) data presentation and analysis, and a case study focussing on RS applications for dryland management in Brazil.
Day 2: Remote sensing for precipitation estimation
We were introduced to the theoretical elements of RS for precipitation estimation by the team from NASA-ARSET. This happens using both passive and active RS approaches. Clouds emit IR, and passive sensors can be used to get rough estimates. However, by using active microwave remote sensing (i.e. the satellite has an energy source and uses this to actively emit electromagnetic radiation in the microwave band), atmospheric profiles and actual measures of the amount of water in the atmosphere can be made.
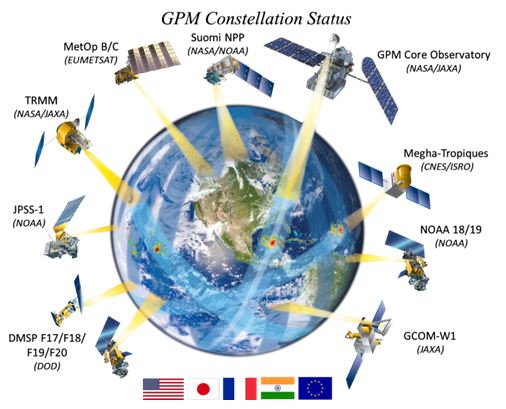 Global coverage is achieved by having a number of space agencies cooperating, with data from a large number of satellites contributing to global datasets, and calibrated with rain gauge data from across the world (for example, see the figure on the right showing the satellites involved in the Global Precipitation Measurements (GPM) mission).
Early initiatives (starting in the 1980s) concentrated on collecting data for the tropics – the so called ‘Tropical Rainfall Measurement Mission’ (TRMM) – so unfortunately long records of global coverage do not exist, as they do for tropical regions. More recently, a new product called IMERG – developed under the GPM (Global Precipitation Measurements) mission – is starting to provide integrated global coverage at astounding levels of spatial and temporal resolution. For example, for the UK, half-hourly rainfall at a spatial resolution of 0.1° x 0.1° (roughly 7 km x 7 km) are available. Historic rainfall data at this resolution are accessible from March 2015 onwards and current data can be available with only a 6hr latency.
Day 3: Using satellites for improved flood monitoring and prediction
NASA introduced a number of tools that combine data from various sources and allow you to look at historic rainfall and flood events. They are mostly at a resolution of a couple of kilometres or more, so are great ‘broad picture’ tools. Finding your way through all the various products, levels of processing, data search interfaces and formats is, however, quite a challenge.
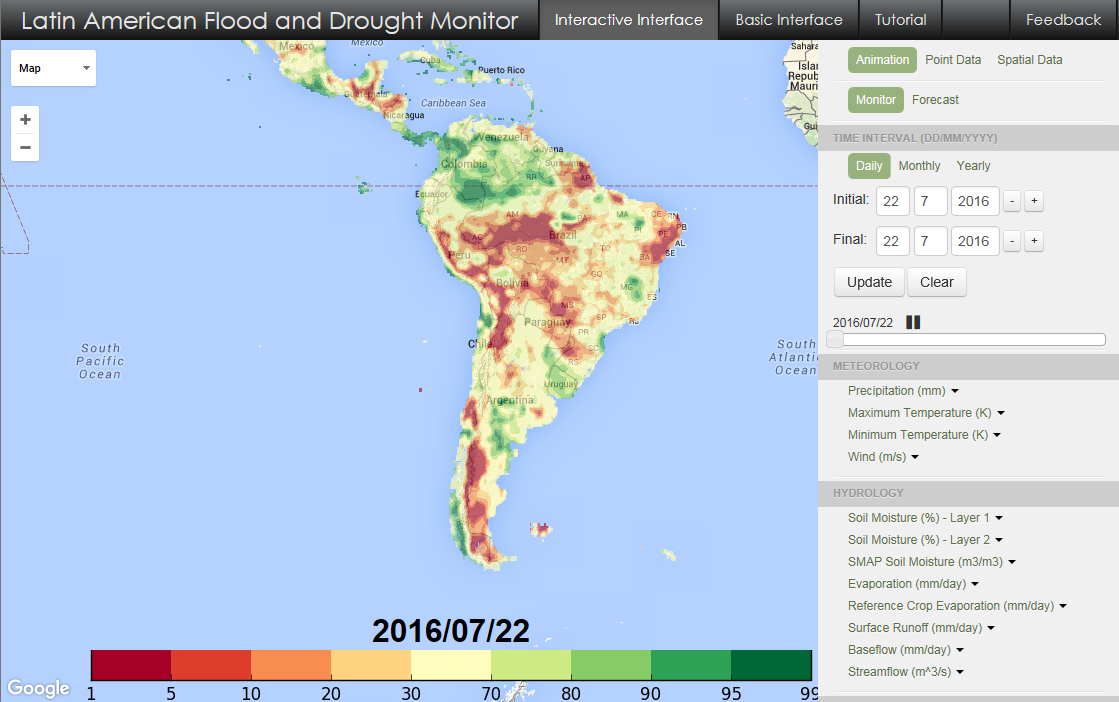
Professor Eric Wood from Princeton University introduced its innovative Flood and Drought Monitor websites (one for Africa and one for Latin America and the Caribbean), which provide a very intuitive, seamless interface to a range of RS-derived data time-series as well as a host of concurrent modelled data, such as river flows. These can be viewed as time-based animations, so you can easily watch a drought or flood unfold over time. They also provide some forecast scenarios, so have value in forward planning as well as understanding past events. All the spatial data can be downloaded for an area of interest. Additionally, point data can be explored and graphs of time series generated for a chosen point. The graphs are interactive and zoomable. They can be downloaded as graphics, and the data that drives the graphs can also be downloaded in an Excel-friendly format for further analysis. The spatial resolution is appropriate for national and regional application. These are great looking tools. In contrast to the metadata rich NASA sites, we thought that perhaps more metadata about the tools and the underlying data they present is needed. It is important when making management decisions that the data (and assumptions) underpinning the animations and visualisations are fully understood.
One of the sessions we were really looking forward to was the one on radar-based remote sensing – which was new to both of us. This type of remote sensing is important for diverse applications such as mapping topography, wetlands, soil moisture, oil spills and land cover. The advantage of radar over multispectral remote sensing is that radar data can be obtained day and night, and regardless of weather conditions or cloud cover.
The NASA trainer was great and explained a complex technical subject in a very understandable way – even though we were listening to a simultaneous translation from Spanish into English. The small exercise was useful – but the need for powerful computers was very clear. The software used was developed by the European Space Agency (ESA), and the data was from their new Sentinel satellite constellation.
These satellites provide an incredible range of data products at high spatial and temporal resolutions for earth systems monitoring, and, like NASA data, is free to registered users. The Sentinel-1 satellite has a synthetic aperture radar (SAR) instrument which is providing high resolution data (5-20m globally). Whereas Sentinel-1 carries a radar based sensor, Sentinel-2 has a high resolution multispectral imager with a resolution of 10-60m at a global scale. A number of important products are generated using this (e.g. land cover and vegetation studies). These products are definitely worth exploring.
Day 4: Remote sensing of evapotranspiration and topography
On Saturday morning, the training focussed on estimating evapotranspiration using remote sensing. Evapotranspiration is a difficult process to measure, even at field scales. Remotely sensed data can be of great use in deriving spatial indicators of this important hydrological process. The session focussed on using RS derived data as inputs into established methods of evapotranspiration estimation. The hands-on exercises focussed on using derived estimates in combination with RS derived precipitation estimates to calculate local water balance estimates and inform agricultural management decisions.
Until this session we were both unaware of the number of value-added RS products NASA publish; there is much more available than the actual satellite observations. One of the key skills that is needed is to navigate through it all, and make good selections of data that take cognisance of the scale and focus of the project for which it is intended.
The second session was about RS-derived topography data. We downloaded some shuttle radar topography mission (SRTM) data and performed some rudimentary analyses. This global dataset was obtained over a period of 11 days by the Space Shuttle Endeavour in February 2000. The 2014 release of this data, at 30m resolution has been improved by supplementing with observations from other sources and is free to registered users of the Global Data Explorer. One of the interesting discoveries about this data was that it was derived from Band C radar – which cannot penetrate vegetation. This means that the SRTM data is a global digital surface (i.e. not necessarily ground surface) model. It has been a very useful part of the course to learn about all the RS data portals – although there is a bewildering array of portals, tools and download processes.
Day 5: Trip to the Iguaçu National Park
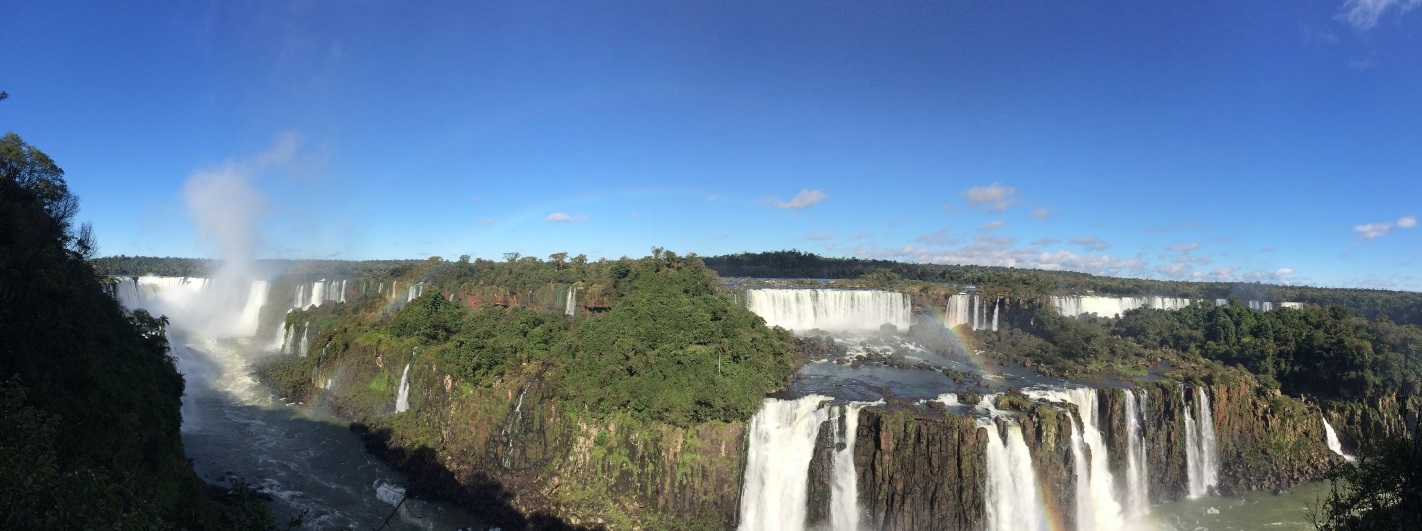
When we arrived in Brazil the temperature was a balmy 24˚C and it was quite humid – five days later, on our free day, it was unexpectedly freezing. The organisers kindly took us to see the Iguaçu Falls – which defy expectation in every way – truly spectacular and appropriately recognised as a wonder of the world. The short walk – a round trip of about 1km – kept revealing increasingly awe-inspiring views – the falls are over 2.5km long and consist of more than 270 individual cascades.
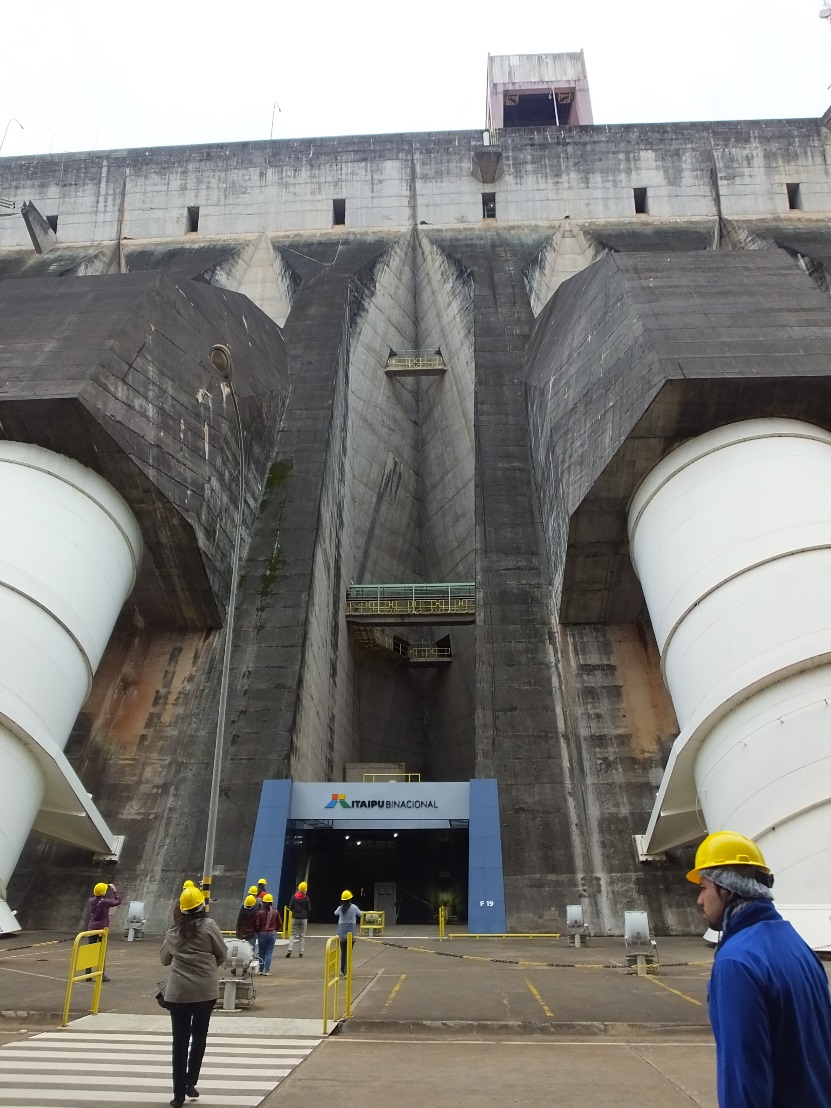
Day 6: The Itaipu hydroelectric scheme; remote sensing of snow and ice
The trip to the Itaipu Dam on Monday morning was a complete contrast. The statistics regarding this structure are quite mind blowing (have a look at the Wikipedia entry). The most revealing is that it is one of the most expensive objects ever built, and not without controversy. It is one of the world’s largest hydroelectric schemes, in ongoing competition with China’s Three Gorges Dam for electricity production records. The tour was fascinating and the scale of the structure revealed views of long galleries and high vaults of shuttered concrete.
This vast project is a joint venture between Paraguay and Brazil – and the area around the dam is an international zone. In fact, the layout of the control and distribution facilities of the scheme have been constructed so that the border runs exactly down the middle of the key rooms, with Paraguayan staff on one side and Brazilian staff on the other.
The afternoon session focussed on remote sensing of snow and ice, primarily based on radar RS. This is a very important element of drought and agricultural resilience planning in places that rely on snowmelt for freshwater, such as Chile or California. In addition to snow cover, information can be gathered about snow depth, and even flake characteristics. For this session, Dr Eric Sproles joined us from Chile via Skype, giving a very informative presentation on snowmelt forecasting where field data is very limited.
Day 7: Remote sensing for drought monitoring
Tuesday saw the focus shift to drought, and in particular, a tool called Spirits for the analysis of long time series of RS or RS derived data. It is developed by a European agency, VITO, based in Belgium, and is able to very efficiently calculate long term trends across times series, and measure anomalies from the trend using a range of statistical approaches. The European Space Agency supplies data suitable for analysis through the Copernicus Programme, although it can also import a number of generic spatial formats. We experimented with data for Ethiopia, looking at long term trends in vegetation using a composite Normalised Difference Vegetation Index (NDVI) (a derived index which represents vegetation health/vigour), combining data for each 10-day period (called a ‘dekad’ which is used to ensure complete coverage as some satellites need a couple of orbits in order to develop a complete global dataset). Spirits has tremendous potential for analysis of any long term spatial data.
Day 8: Remote sensing of soil moisture
The final day was focussed on soil moisture measurement. Several NASA satellites provide soil moisture data, but their main mission is SMAP (Soil Moisture Active Passive). This is a radar-based sensor able to measure soil moisture to a depth of 5cm. After being introduced to the satellites and sensors we downloaded some data and visualised it using one of the open source tools we were introduced to during the week. SMAP data’s quite coarse resolution of 36km is partly due to the failure of the active on-board instruments, but for large regional and national applications it is likely to be useful. We combined soil moisture data and other climatic and vegetation data in Excel to look at the relationships between them. The instructors did warn about the levels of uncertainty associated with the presented values for some of the RS measurements, but emphasised that the patterns, trends and relationships that can be observed are useful and informative.
In the afternoon, we did some ‘field work’ – unusual for an RS training event. NASA is supporting a global citizen science project, called GLOBE, to collect soil moisture data that it can use to validate and calibrate the SMAP RS data. This is an excellent project and could easily involve UK schools and university students. It requires routine collection and analysis of soil moisture (NASA supply all the necessary instructions) taken as the SMAP satellite is passing overhead. The data is then submitted to NASA for incorporation into their data validation routines.
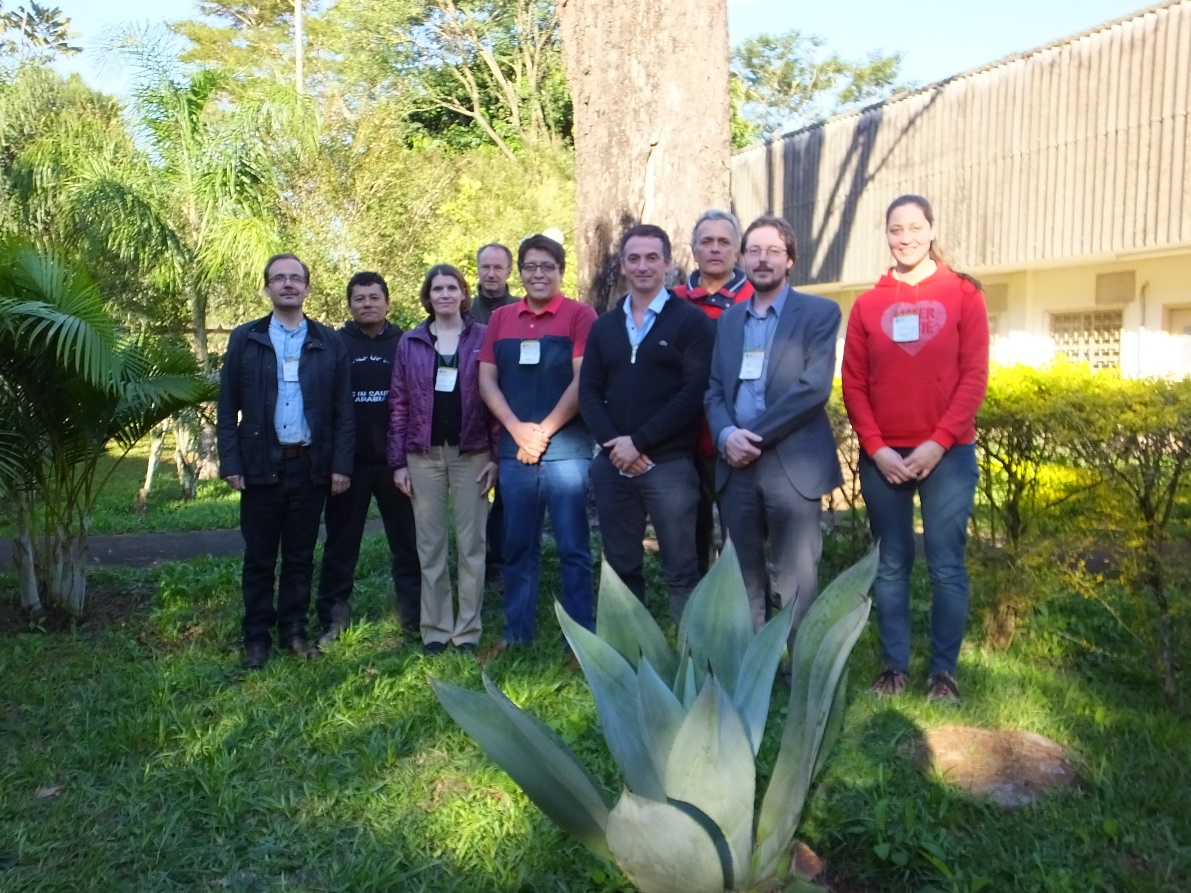
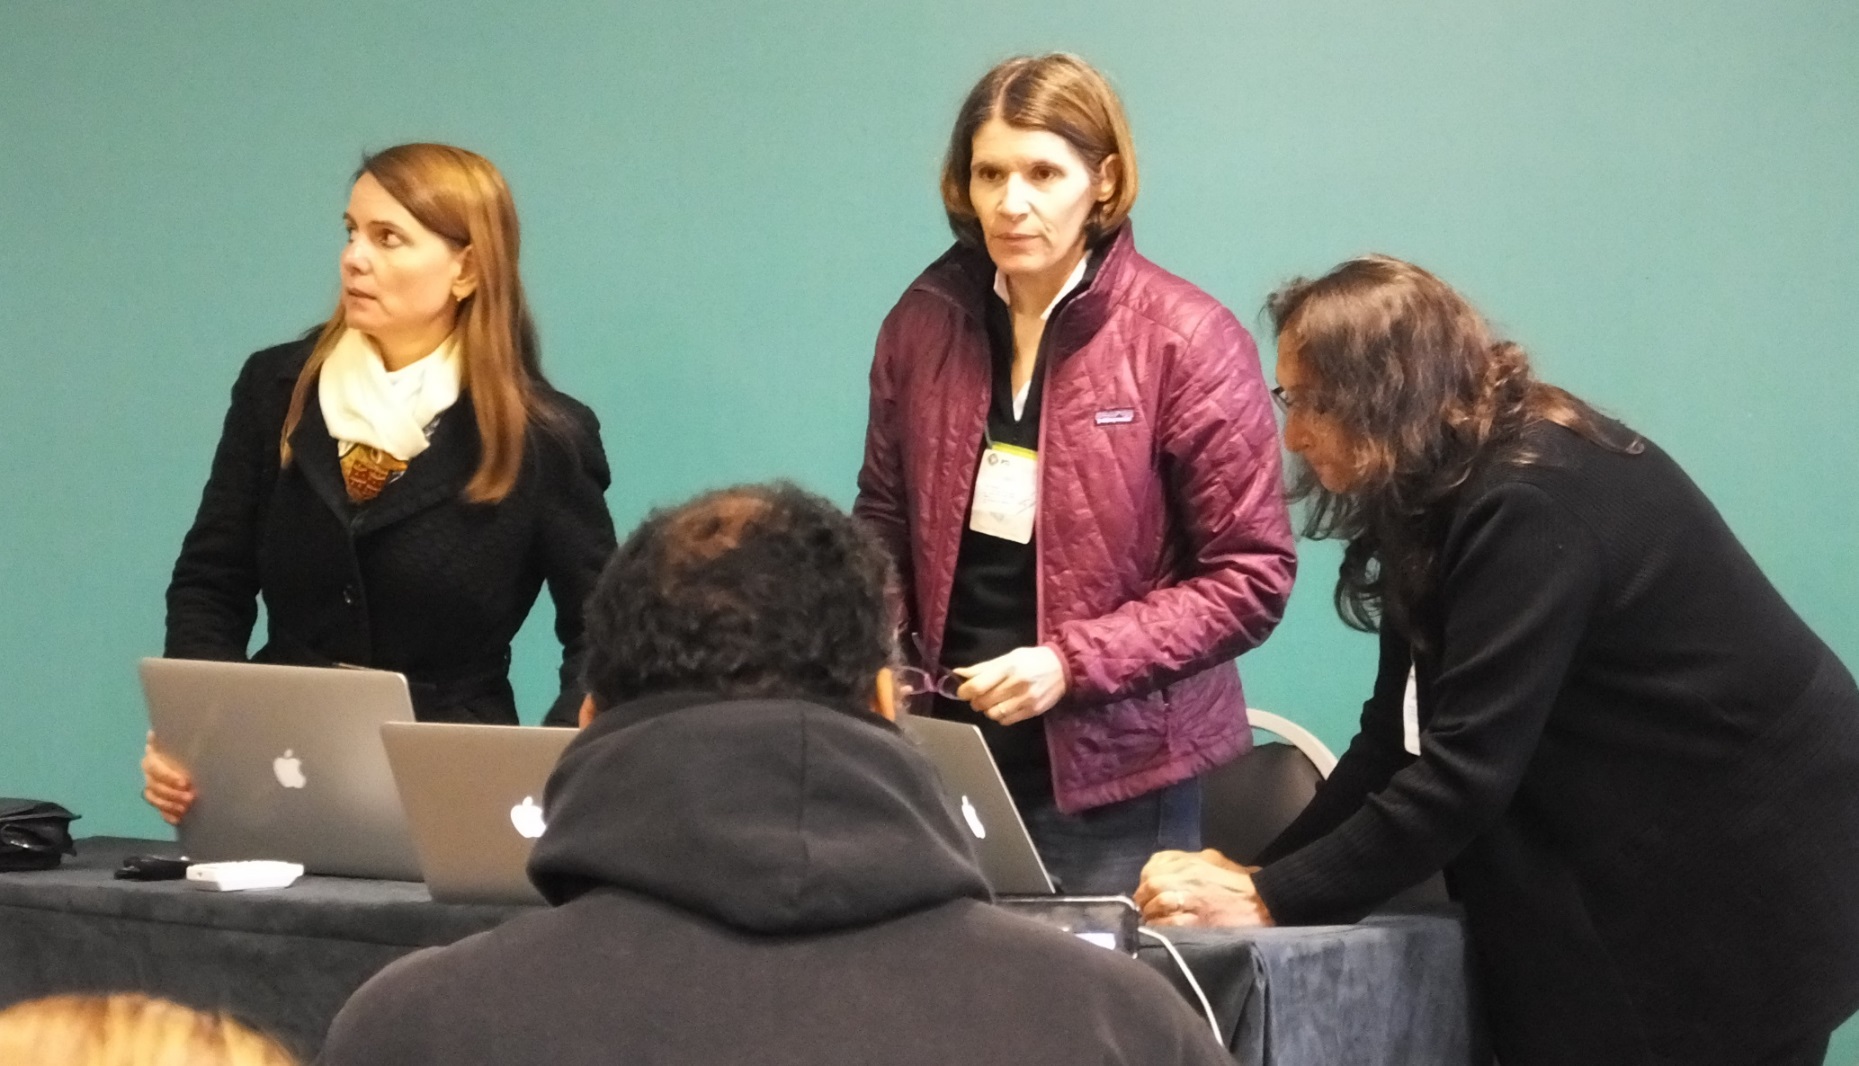
(UNESCO-IHP – second right) and Ana Prado (NASA-ARSET – third left).
Last thoughts
It was an excellent, exciting and intense week, we learnt a tremendous amount about remote sensing that will have direct impact on our teaching and research activities.
We are very grateful to the International Water Security Network (IWSN) for covering our airfares and the Department of Geography at the University of the West of England for the accommodation costs.
IWSN also supported another seven participants from various countries in Latin America and the Caribbean, all of whom asked us to convey their appreciation to IWSN for contributing towards costs.
***
PDFs of the presentations given during the course are available here.